positions
Positions are your actual stock holdings. The app provides add, edit, close (including partial close) or a complete delete
of your holdings, that is, your positions.
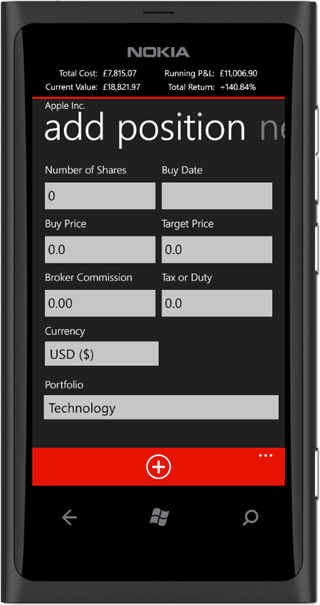
From the summary page of a stock, you swipe left. You are required to enter the number of shares and buy price for the position.
The buy date is defaulted to the current date, the broker commission is defaulted to the broker commission set in the app settings.
If the stock has existing positions, the portfolio will be set to the stock's portfolio otherwise to the default portfolio.
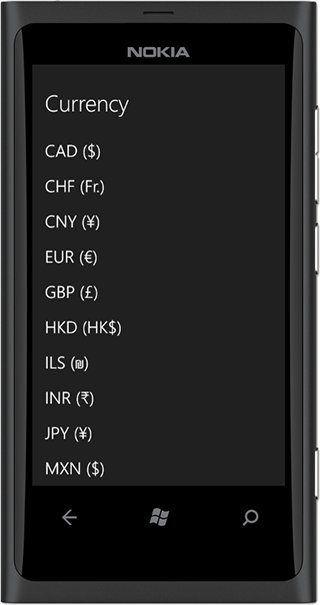
When a stock is entered for the first time, the currency may not be detected. You can select the stock currency from the list.
Editing a position is very similar to adding a new position. Note that if you change a position currency or portfolio, it will be changed for all other positions
of the same stock. For example, position A opened for AAPL (Apple Inc.) on date 1 and position B opened for AAPL (Apple Inc.) on date 2, if you edit position B currency
or portfolio, it will be edited for position A because the currency and portfolio properties belong to stock AAPL (Apple Inc.).
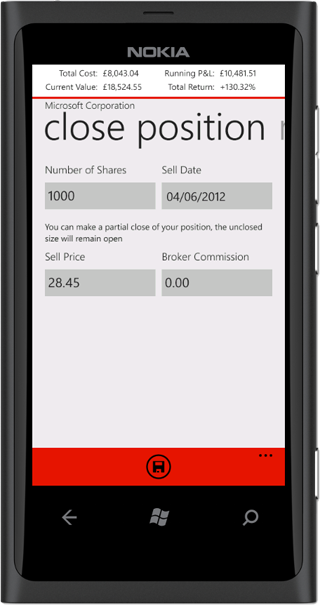
After you sell your holding, ideally you will need to close the position in the app by recording an equal amount of number of shares as was on opening.
The app however supports partial close, for example in a situation you opened a position for 1000 shares but only selling 500 shares.
Note that partial close is not supported when you have position aggregate enabled.
You can delete a position entirely either by selecting the position in the positions tab from the main pivot page or by pressing the delete button
in the app bar on the position summary page. A deleted position is completely removed from the app and cannot be retrieved.
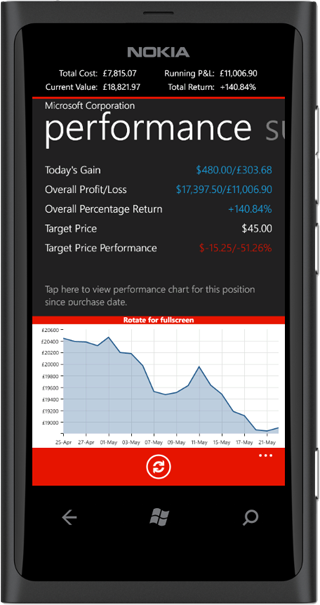
One of the unique features of Markets & Me is the position performance tab, which provides a brief summary of how the specific position for the stock
as performed over-time and since buy date. If you have position aggregate enabled, the performance tab will show for all stock positions.
The performance page shows the gain made on the day for the position, the overall profit/loss with percentage return. If you have a target price, it will display the price as well
as the deviation from the target price. Prices are displayed both in the stock transaction currency as well as the base currency.
The page will show the performance chart of the position in the last 21 days at most, when you rotate for full screen, you will see the performance chart since purchase date.